Unboostered Brits Infected and Dying at Higher Rates than Unvaccinated
UKHSA Vaccine Efficacy Statistics: Week 3
The UK Health Security Agency has been condemned for months to report incredibly inconvenient vaccine efficacy statistics. How they have struggled. They have composed disclaimer after disclaimer. They filled a whole blog post with special pleading. They have greyed out the inconvenient numbers.
In their latest report, published just this evening, they’ve tried something new and bold. They now only calculate case, hospitalisation and death rates for the unvaccinated and the triple vaccinated. The double vaccinated have been banished entirely from Table 12. This will make the evil negative efficacy go away, right?
Ha, no:
The numbers are unadjusted, it is true; much uncertainty surrounds the size of the unvaccinated population and therefore case rates within that group. What is more, these are cases, not true infection statistics. Nevertheless, res ipsa loquitur. It is not a great look.
In fact, the UKHSA have given us a great gift, in that they finally provide separate case and severe outcome statistics for the triple-vaccinated and the double vaccinated, allowing us to compare rates across all three groups. They don’t do that themselves, of course, but no matter. We can use the raw numbers and rates from last week’s report to derive the total number of double and triple vaccinated, and the rates in this week’s report to derive the triple vaccinated population. A little subtraction then gives us a decent estimate of how many double but not triple vaccinated people there are in each age bracket.
Here is the graph the UKHSA don’t want you to see:
This is plainly a pandemic of the vaccinated.
The double vaccinated death rate is also a problem. You can tell this just from looking at the numbers in each category:
The crucial 70+ demographic is over 90% boostered, and yet the very few double vaccinated in this cohort manage to match or exceed theeir death numbers.
The death rates have the double vaccinated worse than the unvaccinated in the 70+ cohort, and roughly matching the unvaccinated in the 60–69 group:
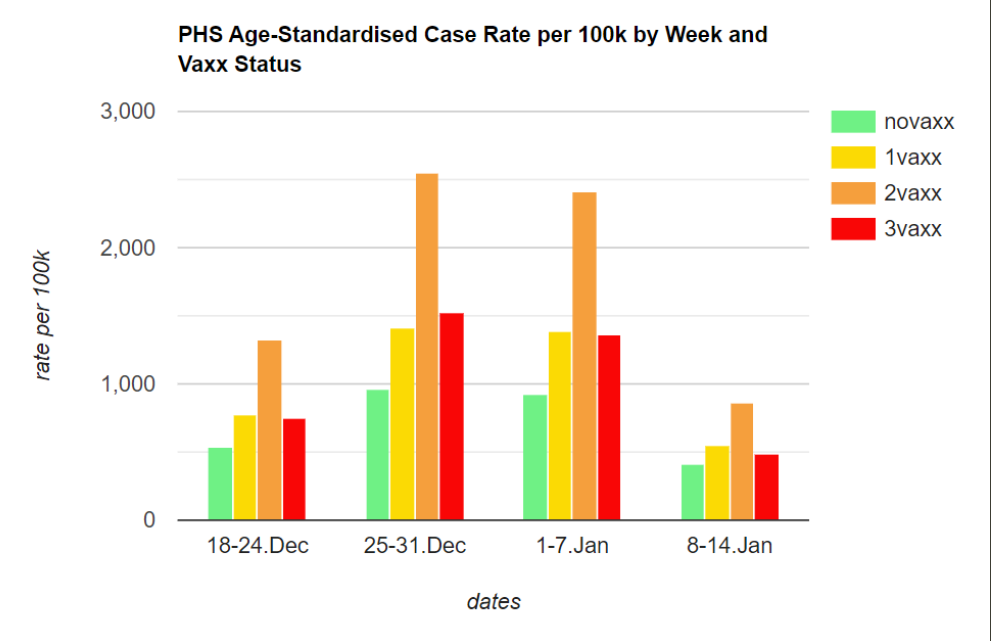
This isn’t all that surprising, given that Public Health Scotland data has shown across-the-board negative efficacy for the unboostered for some weeks now:
This is also true of deaths, but beware of the extremely low numbers, particularly in the singly vaccinated:
UPDATE: Many in comments wonder to what degree heightened susceptibility to infection after boosting could account for the appearance of negative efficacy against infection: Any infections within 14 days of the third dose would count as infections in the double-vaccinated.
It’s important to keep the chronology of the UK booster campaign in mind.
The red line is the week of 20 Dec., the beginning of the four-week window for the latest report. Indeed, a lot of under-50s were within 14 days of their third dose for this period. But the over-60 crowd was mostly boosted by the end of November. This is a plausible explanation for some of the negative efficacy in younger cohorts, but it’s not the only thing going on here.


It is also important to note that the boosted have very low rates because of the statistical malpractice of not counting them as such until two weeks after the shot. (El Gato Malo among others has some posts on it.)
On one foot, what happens is that a boosted individual gets sick before the 2 week mark, he is counted as "unboosted", skewing the results - making vaxxed, but not boosted looking worse, and those who are boosted better. This is especially true with very high infection rates, when a large proportion of people gets sick within those 2 weeks.
[Actually, I just saw a similar comment already made, but still keeping this one]
Begs the question that with each successive booster plus five to eight months of time, if the outcome for those immune systems gets even worse. In other words, will the people currently with three shots be in even worse shape than the two shots gang six months from now.