SARS-2 Didn't Care About DDR Borders Until the Vaccines
A brief historical look at Corona incidences in Germany
In the aftermath of my suggestion that Omicron BA.5 prefers hypervaccinated west Germans and avoids the lesser-vaccinated former DDR, I’ve heard a lot of theories. I’ve heard about demography and age structures and population density and testing and masking rates, about the timing of third and fourth vaccine doses, and about many other things.
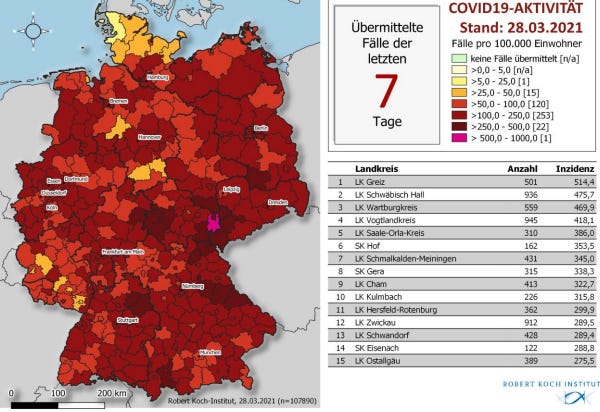
Here, I want to make one point clear: Before December 2021, no DDR Effect is visible anywhere in the German case data. The only discernible patterns are seasonal and geographical. As a rule, Corona begins the season in the south-east; gradually moves outwards, to the northwest; and remains relatively muted in the far north.
You can see this incipient pattern as early as the second wave. Here’s how the 7-day incidence appeared on 23 November 2020 …
… and on 23 December 2020:
Elevated southeasterly incidences persisted well through the spring, as in this map from 28 March 2021:
Aside from a great deal of vaccination, not much happened in Summer 2021, so we skip to the Fall, where cases began to spike – as they had the year before, in the southeast. Here are incidence maps for the weeks ending on 14 and 21 November:
The higher incidences are down more to mandatory testing in schools and elsewhere, than to the greater infectiousness of Delta.
It’s late into the Delta wave that we see the first hints of a DDR Effect, but in reverse. As the winter solstice approached, the lesser vaccinated former DDR states began to see substantially higher case rates. Here are incidence maps for 6–12 and 13–19 December:
A month later, though, Delta was gone, replaced by Omicron; incidences spiked as never before and the DDR Effect vanished. You can see the beginning of the Omicron surge in these maps from 10–16 and 17–23 January:
After January, the maps turn almost entirely pink and there’s no point in studying them. As the Omicron wave regressed, though, elevated case rates persisted in the more heavily vaccinated populations of the West, while the lesser-vaccinated former DDR began to see better case statistics. This is the return of the DDR Effect; we see early glimmerings in these incidence maps for 11–17 and 18–24 April:
The pattern only becomes more pronounced in these maps for 9–15 and 16–22 May …
… and with the arrival of BA.5, as in the map I posted yesterday:
In summary: Lower vaccine uptake in the former DDR led to higher rates of natural immunity as infections surged in the Delta wave of Fall 2021. What is more, the first Omicron lineages already had a slight preference for the vaccinated, which seems to have only grown more pronounced with BA.5. No DDR Effect is visible anywhere in the German data prior to mass vaccination and Omicron. It is not an artefact of demographics or population density or anything else. If it were, we would’ve seen it before December 2021.


This is a great analysis and addresses the artifactual issues I worried about in your previous analysis. Well done.
This is absolutely brilliant and undeniable! In 2 and 1/2 years of watching and reading COVID data this is among the very best! Job well done!